I Turned a Raw DHIS2 Export Into a Full District Analysis in Under a Minute — Here's the Tool
Every month, district health offices across Africa pull the same kind of file out of DHIS2: a wide, awkward export with one column per facility and a couple of hundred indicator rows, names half in English and half in French, blanks everywhere a facility didn’t report. Then someone — often me — spends hours in Excel turning that into indicators a report can actually use.
I got tired of doing it by hand. So I built a tool that does it in one pass, and today it’s live for anyone to use.
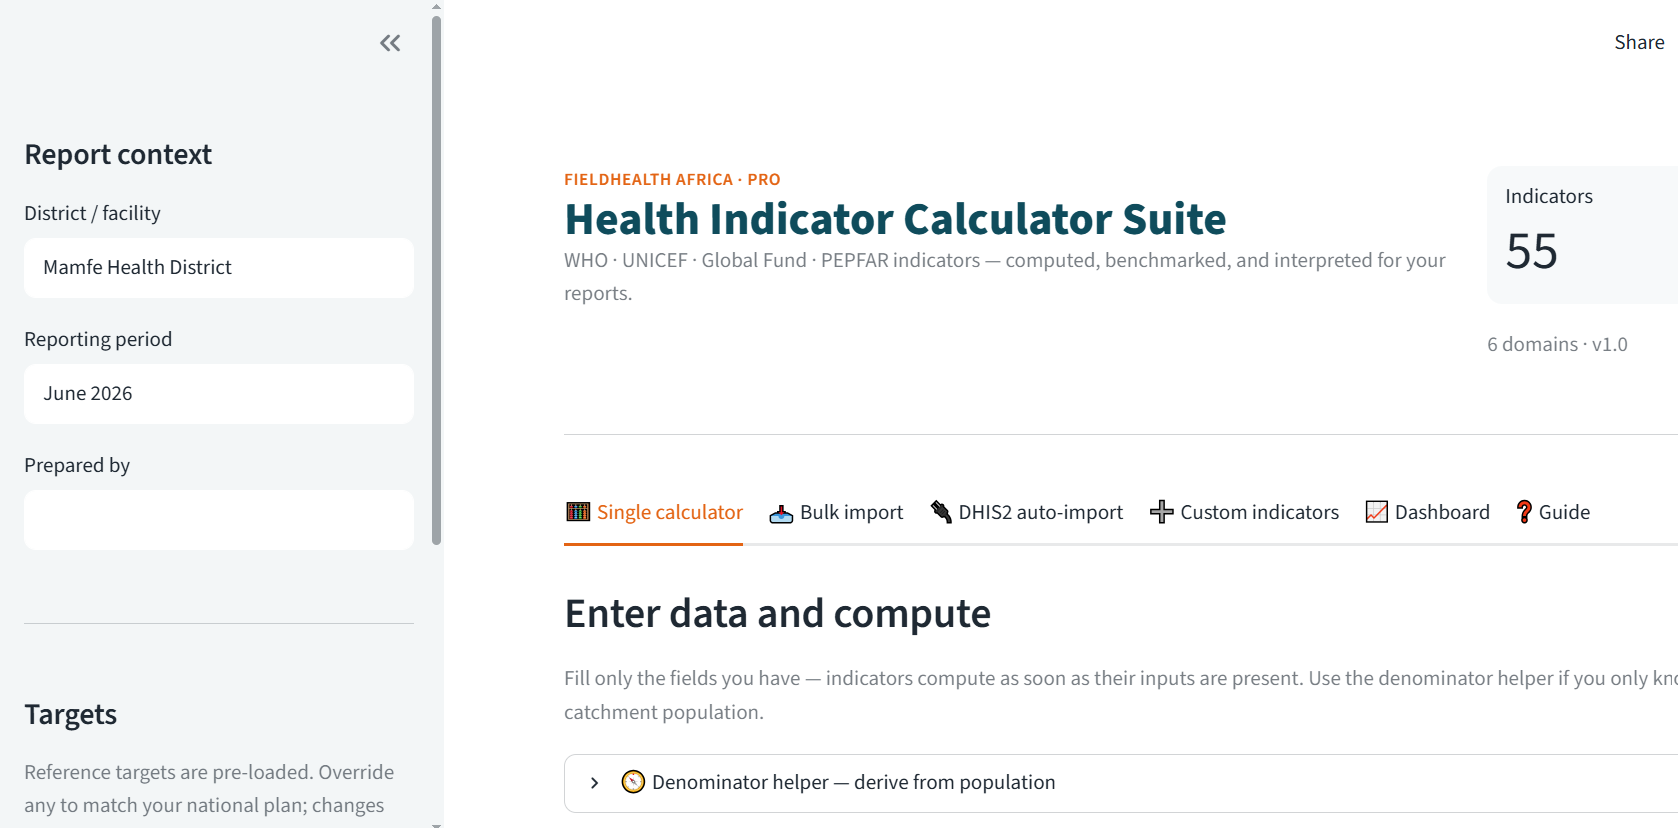
What it is
The Health Indicator Calculator Suite computes 55 standard public-health indicators across six domains — service coverage and the full EPI schedule, HIV/TB/Malaria programmes, mortality, nutrition, service utilisation, and data quality — and benchmarks each one against WHO, UNICEF, Global Fund and PEPFAR reference targets. For every result it writes a plain-language line you can paste straight into a district or donor report.
Three ways to use it:
- Type the numbers for a single facility or district. If you only know the catchment population, it estimates expected pregnancies, deliveries and surviving infants for you.
- Upload a raw DHIS2 / HMIS export. This is the part I’m proudest of. Drop in the monthly pivot file exactly as it comes out of the system. The tool detects the layout, reshapes it, recognises the standard data elements automatically, and computes indicators for every facility at once — no manual mapping.
- Define your own indicators for anything your programme tracks that isn’t already built in.
Benchmarks are editable, so you can swap in your own national targets, and there’s bulk multi-facility computation and Excel / CSV export on every result.
The test that convinced me
I ran it on my own district’s March export — 90 facility columns, 253 data elements. In under a minute it reproduced my hand-checked numbers exactly and surfaced the finding that mattered: only 41% of women who register for antenatal care reach their fourth visit. ANC coverage looks fine at first contact, then women fall away. That single number reframes where the district should put its energy — and the tool put it on the table without me touching a formula.
Why now
Global health financing is contracting hard — down about a fifth in a year, with further cuts expected through 2026, and M&E teams cut along with it. The honest response isn’t to do less; it’s to make the remaining hours count. A tool that turns a monthly export into a benchmarked, report-ready analysis in minutes is exactly the kind of leverage smaller teams need now.
Try it
The full Pro tool — all 55 indicators plus DHIS2 import — is live:
Launch the Health Indicator Calculator Suite →
It’s $79 one-time, or $29/month, with institutional licensing at $299/month for teams. Payment via MTN MoMo, Orange Money, or card. Built and tested in a Mamfe DMO office — not a prototype, a field tool.
A free Lite version for practitioners is on the way as a companion — I’ll share the link here as soon as it’s ready.
If you work with routine health data, try it on your own export and tell me which indicator I should add next. I’m building this in the open, from the field.
You can find it any time on the Pro Library.
— Dr. Nzozone Henry Fomukong
[ STAY_CONNECTED ]
New tools. Field notes. No noise.
Get notified when new tools launch and read dispatches from the district — straight from Mamfe to your inbox.

Dr. Nzozone Henry Fomukong
MD · Field Epidemiologist · DMO, Mamfe